Powered by .id (informed decisions) for Lithgow City Council
.id community is an evidence base for over 250 local government areas in Australia and New Zealand, helping you make informed decisions.
LEARN MORE ABOUT .id140 kilometres west of Sydney, the Lithgow City Council area sits on the western edge of the Blue Mountains, within the Central Tablelands of New South Wales. Population is dispersed throughout the major urban centre of Lithgow, townships of Portland and Wallerawang, eight other small rural villages or hamlets, or the rural residential holdings of the area.
Lithgow City Council acknowledges that the Wiradjuri people were the first peoples of this country. European settlement dates from 1813, with the crossing of the Blue Mountains bringing the first settlers to the area to forge the road from Sydney to Bathurst. This opened the land for pastoral settlers, and the small towns of Bowenfels, Hartley and Hartley Vale emerged along the road network to service the travellers and surrounding rural users. The focus of the major township turned from Bowenfels to Lithgow with the passing of the Sydney to Bathurst rail line through the site of the now Lithgow township in the 1860s and 1870s.
Lithgow's mineral deposit riches of coal, iron and copper brought a rush of migrants to the area. By end of the century, on the back of the mining activity, Lithgow had developed into Australia's fourth largest city. Lithgow's manufacturing capacity rapidly matured, puddling Australia's first steel in 1900 before the Lithgow Small Arms Factory opened in 1912, representing the first modern manufacturing plant in Australia.
In 1929, Lithgow's Iron and Steel making operations were moved from Lithgow to Port Kembla. Transportation costs promoted Illawarra and North coal as preferrable to the Western coal, compounding the contraction in employment and hardship felt through the depression years. Economic reprieve arrived with the outbreak of World War 2, resulting in the rapid expansion of the Lithgow Arms factory, with hostels erected to accommodate a swelling population of 35,000 in the township by 1943, before settling to 24,000 post war.
From the late 1950's, a local coal market re-emerged, with the Wallerawang powerplant construction. The powerplant was central to Lithgow's economy through the latter half of the century. During the 1990s however, Lithgow experienced an economic downturn, with many mining and manufacturing operations closing. The last two decades has seen relative stability in the overall population of the council area.
Recent migration trends have indicated in-migration centred on population aged over 55, and out-migration centred on population aged between 18-24. Pre-retiree and retirees are moving from Blue Mountains and western Sydney, attracted to Lithgow's liveability and affordability. Tertiary and recently independent age groups are moving largely to centres with better education and employment opportunities, namely Bathurst and Newcastle. A significant group of working age population in the Blue Mountains have also moved to Lithgow for more affordable living, while maintaining access to their employment outside of the area.
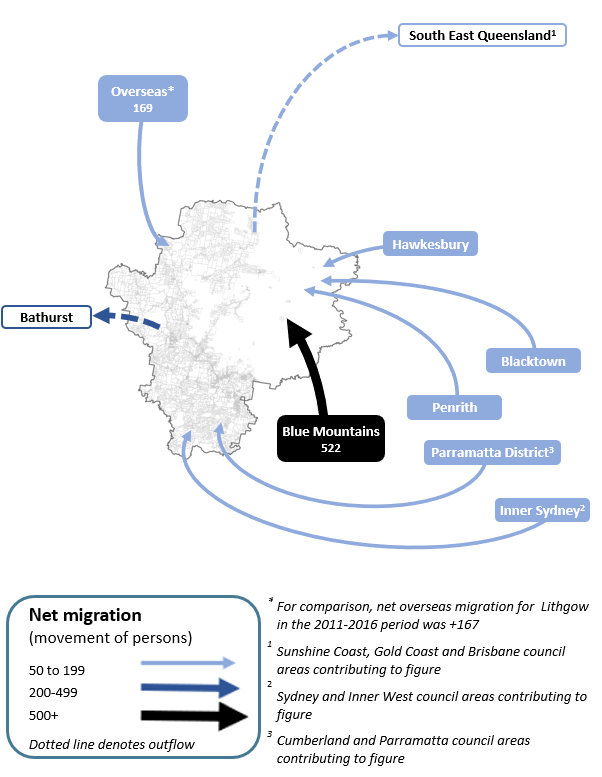
Note: The migration flows depicted above are historical and do not represent future or forecast migration flows or subsequent council boundary changes. The arrows represent migration flows to the area as a whole and do not indicate an origin or destination for any specific localities within the area. Overseas flow shows overseas arrivals based on answers to the census question "where did the person usually live 5-years ago" and .id estimates of international out-migration.
*Please note, the 2021 Census was undertaken during the COVID-19 pandemic, at a time where border restrictions had largely halted overseas in-migration for the 15 months prior. 2016-2021 net overseas migration levels reflect this and therefore should not necessarily be considered indicative of longer-term trends.
With the variety of residential and rural locations, different areas within the Lithgow City Council area have developed different roles within the housing market. The Lithgow Growth Area (Bowenfels and South Bowenfels - Littleton - South Littleton) are attractive to both young families as well as some retirees. The established Lithgow Urban Area (Lithgow - Hermitage Flat and Morts Estate - Oaky Park - Vale of Clwydd), which include the only medium density offer in the council area, attract a larger share of mature families, young adults and downsizers.
The townships of Portland and Wallerawang attract young families, while mature families and older couples without children are more attracted to the 'rural residential' options that Rural North - Marrangaroo and Rural South - Little Hartley offer.
The variety of function and role of the small areas in the Lithgow City Council area means that population outcomes differ significantly across the LGA.
There are also significant differences in the supply of residential property within the LGA which will also have a major influence in structuring different population and household futures within the Lithgow City Council area. Greenfield development has been most pronounced in the South Bowenfels - Littleton - South Littleton area in recent years, while infill has progressed at the highest rate in Rural South - Little Hartley.
In the near term, greenfield development is projected to significantly intensify in the Bowenfels small area, driving the greatest increase in dwellings in the council area. Substantive infill opportunities in the Lithgow - Hermitage Flat and District and the Portland areas are projected to amplify through the forecast period.
Morts Estate - Oaky Park - Vale of Clyydd, and Wallerawang - Lidsdale are expected to have lesser growth in dwellings.
Rural North - Marrangaroo contains the Marrangaroo Urban Release Area that offers significant potential to accommodate future growth. However, the Marrangaroo URA will not be considered in this forecast until more certainty regarding the release times are available.DISCLAIMER: While all due care has been taken to ensure that the content of this website is accurate and current, there may be errors or omissions in it and no legal responsibility is accepted for the information and opinions in this website.
Please view our Privacy Policy, Terms of use and Legal notices.
ABS Data and the copyright in the ABS Data remains the property of the Australian Bureau of Statistics. The copyright in the way .id has modified, transformed or reconfigured the ABS Data as published on this website remains the property of .id. ABS Data can be accessed from the Australian Bureau of Statistics at www.abs.gov.au. ABS data can be used under license - terms published on ABS website. intermediary.management@abs.gov.au if you have any queries or wish to distribute any ABS data.