Ellenbrook
Components of population change
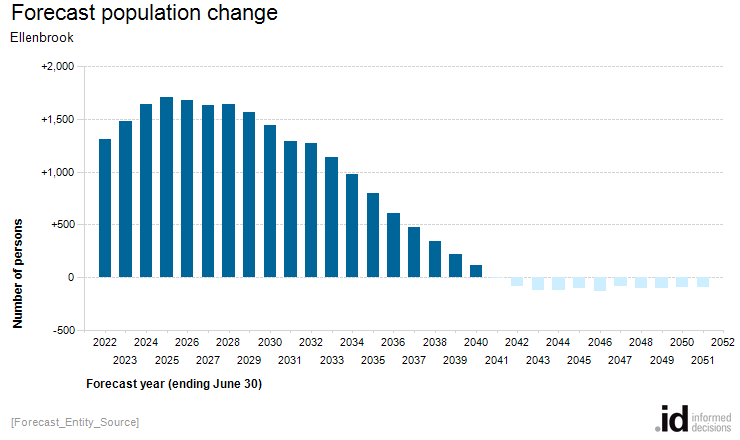
The greatest population change for Ellenbrook is forecast for the period from 2022 to 2026, which is expected to have a net increase of 7,823 people.
There are two ways in which populations can change, through net migration and/or through natural increase (births minus deaths). Some areas are more driven by one or other of these factors. Migration is largely driven by housing development, whereas natural increase is a function of the age of the population.
| Components of population change | |||||
|---|---|---|---|---|---|
| Ellenbrook | Forecast period | ||||
| Component | 2022 to 2026 | 2027 to 2031 | 2032 to 2036 | 2037 to 2041 | 2042 to 2046 |
| Births | 3,948 | 4,649 | 5,121 | 5,161 | 4,934 |
| Deaths | 987 | 1,213 | 1,390 | 1,516 | 1,593 |
| Natural increase/decrease | 2,961 | 3,436 | 3,731 | 3,645 | 3,341 |
| Net migration | 4,811 | 4,094 | 1,048 | -2,499 | -3,915 |
| Change in persons in non-private dwellings | 51 | 51 | 0 | 0 | 0 |
| Total population change | 7,823 | 7,581 | 4,779 | 1,145 | -574 |
[Forecast_Entity_Source]