Powered by .id (informed decisions) for City of Monash
.id community is an evidence base for over 250 local government areas in Australia and New Zealand, helping you make informed decisions.
LEARN MORE ABOUT .idThe City of Monash is located in the established eastern suburbs of Melbourne. The municipality is predominantly residential, although there is a significant industrial belt stretching from Mount Waverley through Clayton-Notting Hill to Mulgrave and there are major commercial centres at Glen Waverley, Oakleigh, Clayton and Mount Waverley. Urban development in the City dates back to the nineteenth century, with Oakleigh being established as a township, but it was not until after the Second World War that significant urban expansion occurred. Initial development along the railway lines quickly spread across the City generally from west to east, a process that continued up until the 1980s. The primary housing market role that the City of Monash played during this period was to provide home owning opportunities for families and prospective families from the eastern suburbs of Melbourne. Nowadays, the City of Monash provides diverse housing stock to cater for the different housing markets within the municipality.
The 1980s were a period of population loss in the City as a number of areas matured, with children leaving the family home, as well as comparatively little residential development to provide housing opportunities. During the 1990s, new development opportunities were taken, with the conversion of school sites (ongoing) and surplus government and utility land to residential purposes. There is significant pressure for residential expansion within Monash from both existing residents and from external migrants, most notably from overseas, as well as areas to the west (Stonnington and Glen Eira), although affordability issues have resulted in the loss of people to the outer east and south east who look for affordable housing in parts of the cities of Casey and Knox . It is assumed that a number of these patterns will continue into the future, notably the large overseas flows into the City. notwithstanding the assumed temporary halt of overseas migration due to the COVID-19 pandemic.
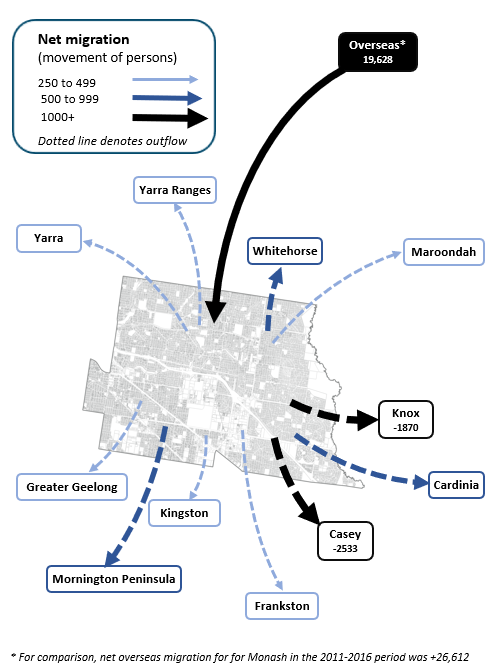
Note: The migration flows depicted above are historical and do not represent future or forecast migration flows or subsequent council boundary changes. The arrows represent migration flows to the area as a whole and do not indicate an origin or destination for any specific localities within the area. Overseas flow shows overseas arrivals based on answers to the census question "where did the person usually live 5-years ago" and .id estimates of international out-migration.
*Please note, the 2021 Census was undertaken during the COVID-19 pandemic, at a time where border restrictions had largely halted overseas in-migration for the 15 months prior. 2016-2021 net overseas migration levels reflect this and therefore should not necessarily be considered indicative of longer-term trends.
With the residential development of the City over several decades and the large size of the municipality, areas have developed different roles within the housing market. These roles generally fall under two categories: 1. Young adults and tertiary students and; 2. Established and mature families. The first pattern tends to affect areas in the south-west of the municipality, such as Clayton (Activity Centre (AC) and Balance), Oakleigh, Hughesdale and Chadstone, due to the proximity of Monash University and a lesser extent Holmesglen TAFE. The second pattern is noteworthy in the north and east of the City, such as Mount Waverley, Glen Waverley (AC and Balance), Wheelers Hill and Mulgrave, where the housing stock, the amenity and attractiveness of the areas drive local migration patterns. This difference in function and role of the small areas in the City of Monash means that population outcomes differ significantly across the municipality.
There are also significant differences in the supply of residential property within the City which will also have a major influence in structuring different population and household futures over the next five to twenty years. The major source of additional dwellings and households in the City will be in the larger redevelopment sites and through infill and medium density development in existing residential areas and strategic activity centres. As the large Waverley Park (Mulgrave) development winds down, other sites - namely apartment developments and school redevelopments around Chadstone, Clayton (AC and Balance), Oakleigh, Oakleigh South and Wheelers Hill will continue providing the high numbers of new dwellings in the short term. Some large future sites, such as the "Monash Homemaker/Nova Centre" site in Clayton (Balance) and the "Former Quarry" site in Oakleigh South will be significant sources of new dwellings to the City of Monash during their periods of development.
Activity centre growth due to the "Oakleigh Major Activity Centre" (Oakleigh), the "Brandon Park Major Activity Centre" (Glen Waverley (AC and Balance), Hughesdale and Wheelers Hill) and the "Wheelers Hill Neighbourhood Activity Centre", will all increase new dwelling supply from the late 2010s and reach high levels (over 100 dwellings per annum) from 2026 until the end of the forecast period and beyond. Increasing rates of infill are expected in Clayton (AC and Balance) and Oakleigh East-Huntingdale due to demand as a result of proximity to Monash University and the fact that these areas have an ageing dwelling stock. The impact of the State Government’s "reformed residential zones" may affect where and how much development occurs in the future although at the time of publishing this forecast, the City of Monash Council has not finalised the assessment for the zones and therefore the potential long term impact.
DISCLAIMER: While all due care has been taken to ensure that the content of this website is accurate and current, there may be errors or omissions in it and no legal responsibility is accepted for the information and opinions in this website.
Please view our Privacy Policy, Terms of use and Legal notices.
ABS Data and the copyright in the ABS Data remains the property of the Australian Bureau of Statistics. The copyright in the way .id has modified, transformed or reconfigured the ABS Data as published on this website remains the property of .id. ABS Data can be accessed from the Australian Bureau of Statistics at www.abs.gov.au. ABS data can be used under license - terms published on ABS website. intermediary.management@abs.gov.au if you have any queries or wish to distribute any ABS data.