Powered by .id (informed decisions) for Hobsons Bay City
.id community is an evidence base for over 250 local government areas in Australia and New Zealand, helping you make informed decisions.
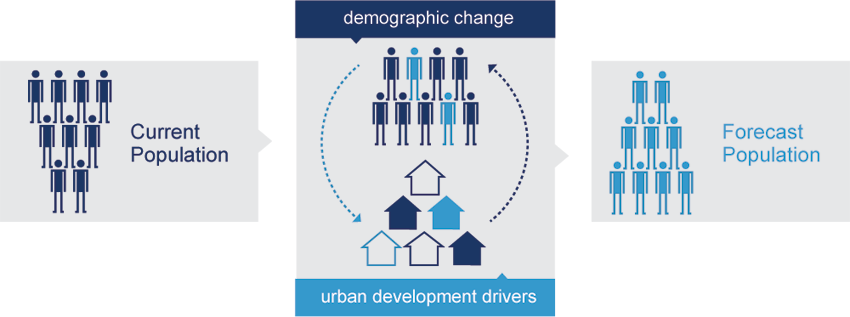
LEARN MORE ABOUT .idThe diagram below describes the general approach used by .id in its population and household forecasts. An analysis of the current population and household structure often reveals the role and function of an area and the degree to which an area may be going through some form of demographic transition.
Demographic changes, such as birth, death and migration rates are applied to the base population. At the same time, scrutiny of urban development drivers is undertaken (residential development opportunities, vacancy rates etc.). The combination of varied assumptions about these inputs results in forecast population and households by type.
The modelling process used for producing the small-area forecasts is based on a 'bottom-up' approach, with all assumptions being derived from a local perspective. The components of the model are derived exclusively from housing and demographic assumptions. The drivers of the forecasts are predominantly based on levels of new residential development and demographic assumptions, such as in and out migration rates from the local areas. The diagram below describes the detail of the modelling process used by .id in its population and household forecasts.
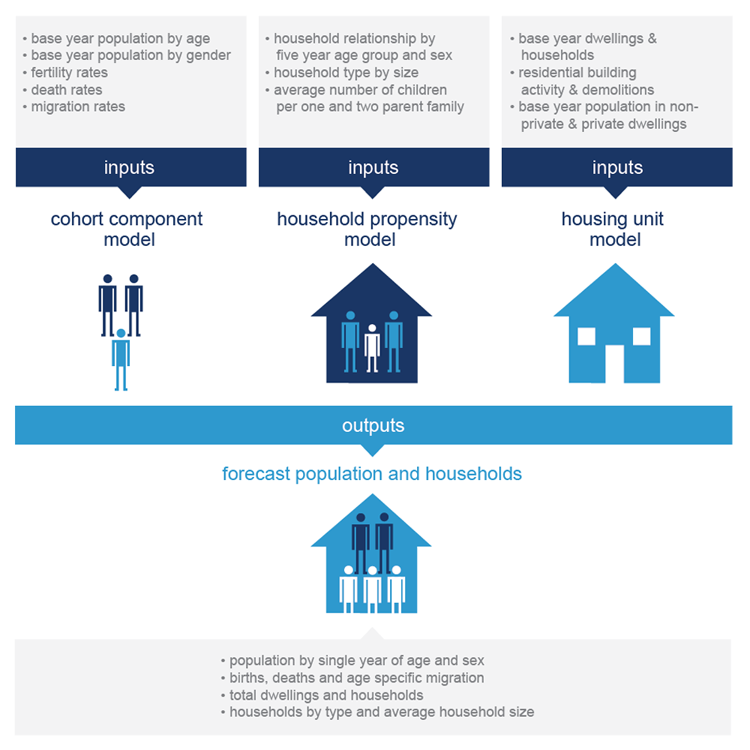
The population forecasts are based on a combination of three statistical models. They include a cohort component model, a housing unit model and a household propensity model. Each of the models has a series of inputs, which when linked to the other models gives the forecast outputs. The models are further explained below.
The cohort component model is a standard demographic model used for population forecasts. It takes a base population by single year of age and sex and makes assumptions about future levels of births, deaths and migration, with the result being a forecast population by age and sex.
Each year the population ages by one year, with additions to population through in-migration and births. Births are derived by multiplying age specific fertility rates of women aged 15-49 by the female population in these age groups for all years during the forecast period. The population decreases are based on out-migration and deaths. Deaths are derived by multiplying age and sex specific mortality rates for all age groups for all years during the forecast period.
In and out migration is based on multiplying the population in each age group by a migration matrix. The base year population is derived from 2021 Census counts and then adjusted to an estimated resident population by small area. Each year through the forecast period, the population is run against age-specific birth, death and migration rates to create new population figures.
The housing unit model is used to forecast future levels of residential development in areas and the resulting impact on the total population and the number of households. This model is critical in giving population forecasts credibility, especially in areas where there are residential development constraints and where historical migration patterns would be expected to change.
The housing unit model is based on forecasting a number of variables. These include total population living in private and non-private dwellings, the number of households and the number of dwellings. The share of housing stock that does not contain households is known as the vacancy rate. The population living in private dwellings divided by the number of households is known as the average household size.
These variables have changing relationships over time, as households undergo normal demographic processes, such as family formation and ageing. Levels of residential development, vacancy rates and average household size (see housing propensity model below) are used as the drivers of the model. Every year there is an assumption about the level of residential development activity, which adds to the stock of dwellings in an area. This stock of dwellings is multiplied by the vacancy rate, which gives the total number of vacant dwellings and the total number of occupied private dwellings (households).
Households are multiplied by the assumed average household size for the year to derive the new number of persons living in private dwellings. The average household size is derived from the household propensity model (see below).
Population in non-private dwellings is modelled separately. A non-private dwelling is a form of housing, which is communal in nature. Examples of non-private dwellings include nursing homes, student accommodation, boarding houses, nursing quarters, military barracks and prisons. In forecasting the number of persons in non-private dwellings, the population is analysed according to the different types of living arrangements. Decisions about future changes may be based on local knowledge through consultation with institutions or local government if there are a large number of people living in non-private dwellings.
This model is used to integrate the cohort component and housing unit models to ensure consistency between the outputs of both models. The model works by assuming that the age structure of the population is an indicator of household size and type. These differences are assumed at the local area based on the household type and size from the 2021 Census.
The population is divided into household types based on five year age groups and sex. Each of these household types has an associated household size. From this relationship, all the household forming population (adults and any non-dependents) effectively represent a share of a household. Dependents in a household (children) represent no share of a household, although their departure frequently drives demand for housing in the region. Lone persons represent 1 or 100% of a household. Couples with dependents represent 50% of household. Couples without dependents represent almost 50% of a household (as they can include related adults). Lone parents represent 100% of a household. Group household members' and other household members' shares vary according to the region (20%-45%, 5 persons to 2.5 persons per household).
These relationships are extrapolated forward from 2021 with some adjustments, depending on the type of area. While for some areas, it is assumed that a greater share of the population will live in smaller households in the future, many areas will go against this trend, depending on their place within the life cycle of suburbs.
DISCLAIMER: While all due care has been taken to ensure that the content of this website is accurate and current, there may be errors or omissions in it and no legal responsibility is accepted for the information and opinions in this website.
Please view our Privacy Policy, Terms of use and Legal notices.
ABS Data and the copyright in the ABS Data remains the property of the Australian Bureau of Statistics. The copyright in the way .id has modified, transformed or reconfigured the ABS Data as published on this website remains the property of .id. ABS Data can be accessed from the Australian Bureau of Statistics at www.abs.gov.au. ABS data can be used under license - terms published on ABS website. intermediary.management@abs.gov.au if you have any queries or wish to distribute any ABS data.