idc-logo
svg rectangle color
City of FremantlePopulation forecast

The City of Fremantle

Drivers of population change

The City of Fremantle is located in Perth’s western suburbs, about 20km from the CBD. It is a diverse area, encompassing residential, industrial, maritime (including major port facilities), commercial, entertainment and tourism land uses. The City encompasses a total land area of about 19 square kilometres, including significant river foreshore and coastline.

Development history

European settlement dates from 1829 when the port was established for the Swan River Colony, with the township established soon after. The main industries were shipping, fishing and farming. Gradual growth took place during the mid 1800s. More rapid growth took place during the 1890s and early 1900s, spurred by the opening of the railway line from Perth in 1881, the opening of the Inner Harbour in 1897, and the gold rush. The City had a population of under 19,000 in the 1911, growing to about 22,000 in 1933, then to about 31,000 in 1954. Significant development occurred from the 1950s into the early 1970s, particularly in the southern and eastern suburbs. The population declined during the late 1970s and early 1980s, but has increased again in the last twenty years due to additional dwelling stock in the form of apartments in former industrial areas. In 1991 the population was just under 24,000, but increased gradually to 33,110 by 2021.

Migration patterns

Traditionally, the City has attracted young adults seeking rental accommodation in close proximity to education, employment and lifestyle opportunities, who then tend to move elsewhere when they reach the family forming life stage. More recently, the City has attracted greater in-migration from empty-nester and retiree populations. The City primarily attracts new residents from other parts of metropolitan Perth, particularly councils in near proximity such as Canning and Melville directly to the east, and Cottesloe and Nedlands to the north. A significant number of new residents also come from overseas. The City loses population to the south (Kwinana and Cockburn), likely home owners seeking affordable housing in nearby proximity.

Historical migration flows, City of Fremantle, 2016-2021


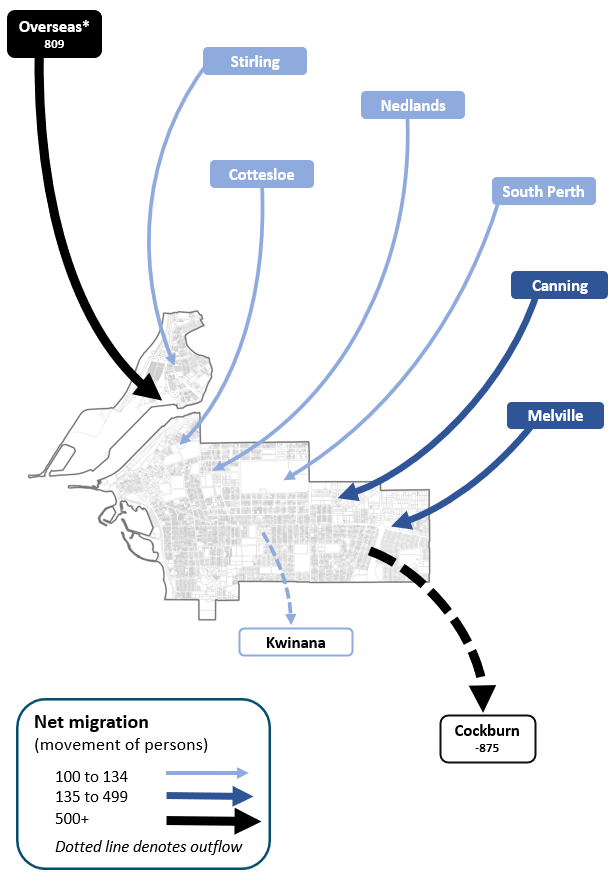
Note: The migration flows depicted above are historical and do not represent future or forecast migration flows or subsequent council boundary changes. The arrows represent migration flows to the area as a whole and do not indicate an origin or destination for any specific localities within the area. Overseas flow shows overseas arrivals based on answers to the census question "where did the person usually live 5-years ago" and .id estimates of international out-migration.

*Please note, the 2021 Census was undertaken during the COVID-19 pandemic, at a time where border restrictions had largely halted overseas in-migration for the 15 months prior. 2016-2021 net overseas migration levels reflect this and therefore should not necessarily be considered indicative of longer-term trends.

Housing role and function

Despite its small size, the City encompasses a diversity of housing market roles, but overall is dominated by the in-migration of empty-nesters and retirees, and out-migration of young families and adults reaching the family forming stage of their life cycle.Inner-city suburbs of Beaconsfield, Fremantle and North Fremantle will experience strong growth, with the former driven by in-migration of mature families, and the latter two driven by driven by empty-nesters and significant inflows of young adults. South Fremantle and White Gum Valley are expected to see minimal population growth, with declining household sizes mitigating the gentle infill development. Likewise, Samson and O’Connor, expected to experience very low levels of infill, will experience a declining population over the forecast period, as homeowners age in place while young adults move out of home.

DISCLAIMER: While all due care has been taken to ensure that the content of this website is accurate and current, there may be errors or omissions in it and no legal responsibility is accepted for the information and opinions in this website.

Please view our Privacy Policy, Terms of use and Legal notices.

ABS Data and the copyright in the ABS Data remains the property of the Australian Bureau of Statistics. The copyright in the way .id has modified, transformed or reconfigured the ABS Data as published on this website remains the property of .id. ABS Data can be accessed from the Australian Bureau of Statistics at www.abs.gov.au. ABS data can be used under license - terms published on ABS website. intermediary.management@abs.gov.au if you have any queries or wish to distribute any ABS data.